Data

Extralimital citizen science observations of marine species relative to historical poleward range limits, 2013–2022 (NESP MaC 1.30; IMAS, JCU and DPIRD)

eAtlas
Wolfe, Barrett ; Pecl, Gretta ; Kjeldsen, Shannon ; Strugnell, Jan ; Watson, Sue-Ann
Viewed: [[ro.stat.viewed]] Cited: [[ro.stat.cited]] Accessed: [[ro.stat.accessed]]
ctx_ver=Z39.88-2004&rft_val_fmt=info%3Aofi%2Ffmt%3Akev%3Amtx%3Adc&rfr_id=info%3Asid%2FANDS&rft_id=info:doi10.26274/J7SR-RP22&rft.title=Extralimital citizen science observations of marine species relative to historical poleward range limits, 2013–2022 (NESP MaC 1.30; IMAS, JCU and DPIRD)&rft.identifier=https://eatlas.org.au/data/uuid/c9cb841d-c84d-40d3-9c17-42ae3f5dcde7 https://doi.org/10.26274/J7SR-RP22&rft.publisher=Australian Institute of Marine Science (AIMS)&rft.description=This dataset consists of the historical range limits and poleward-most extent of recent extralimital occurrence of 82 potential marine species’ range extensions around Australia (NSW, QLD, SA, TAS, VIC and WA) revealed by an assessment of citizen scientists observations from Redmap, Reef Life Survey, and iNaturalist from 2013–2022. The purpose of this project was to assess evidence for climate-driven marine species range extensions with data provided by Australian citizen scientists. While there are at least 198 documented range shifts of marine species in the scientific literature, there are large gaps in our ability to formally monitor changes in species distributions both geographically and across taxonomic groups that citizen scientists (beachcombers, divers, fishers, snorkelers, etc.) can help resolve. This assessment had two main components: Establish historical poleward range limits for each of 200 target species tracked by Redmap (up to the year 2012); and assess the evidence for extralimital occurrence of each species in the subsequent decade across three citizen science databases (Redmap, Reef Life Survey, iNaturalist). Confidence of species range extension occurring was qualitatively estimated (high, medium, or low) based on species traits (e.g., mobility, detectability) and strength of evidence provided by citizen science data (e.g., evidence of overwintering, multi-year detections). These results provide an early indication of species and regions where more focused monitoring or research effort may be warranted. These findings were developed into report cards for dissemination to both demonstrate the value of citizen science and engage with the public on climate change and marine biodiversity, using their own information. Methods: This assessment had two main components: 1) Establish historical poleward range limits up to the year 2012 for each of 200 target species; and 2) assess the evidence for extralimital occurrence of each species in the subsequent decade across three citizen science databases (Redmap, Reef Life Survey, iNaturalist). Confidence of species range extension occurring was qualitatively estimated (high, medium, or low) based on species traits (e.g., mobility, detectability) and strength of evidence provided by citizen science data (e.g., evidence of overwintering, multi-year detections). These methods were a modified version of the Robinson et al. (2015) framework developed through a workshop process in November 2021. The assessment target species list consisted mainly of species on the Redmap (Range Extension Database and Mapping project) target list and a select opportunistic additions, totalling 200 species. Species historical poleward range limits were established up to the year 2012 from both distributional references such as Australian Faunal Directory (AFD, ABRS 2009) and Australian National Expert Fish Distributions (https://researchdata.edu.au/australian-national-fish-expert-distributions/671428) and a review of available raw occurrence data (Atlas of Living Australia, pre-2013 citizen science observations of target species, etc.) to document the poleward-most known occurrences of each target species. Species for which there was uncertainty regarding taxonomy or historical distribution limits that would have a bearing on assessment results were excluded from the assessment. A 20 km buffer was added on to range limits to reduce artifact from range limits established to low precision. Citizen science observations of target species up to February 2022 were accessed from iNaturalist Australasian Fishes project, Redmap, and Reef Life Survey (via the Australian Ocean Data Network). iNaturalist records underwent additional verification by species experts, and as Reef Life Survey data does not formally have photographic evidence associated with it, these data were only used in a corroboratory role for species for which extralimital observations from the other citizen science databases were available. Confidence of potential range extensions evidence by extralimital observations was estimated qualitatively based on detections across multiple years and for non-highly-mobile species, evidence of overwintering (during the coldest months of the year on either coast). Detectability, due to rarity, small size and/or cryptic colouration/behaviour was also taken into consideration. To summarise the extent of each assessed range extension, the assessed historical range limit and the most out-of-range observation were identified for each species and collated in this data set. Locations represent latitudes, or on the south coast, longitudes. Limitations of the data: These data only represent the latitudes (or longitudes on the south coast) of species range limits (as of 2012) and recent extralimital observations rather than precise coordinates. These results only reflect the assessment of 200 target species and not an exhaustive list of marine species range extensions to the present or those reflected in the citizen science databases. Not all assessed extralimital observations indicate a species is undergoing a geographical range extension (see confidence estimates) Format of the data: The dataset consists of a table with 82 instances of potential marine species range extensions noted by the latitude (or longitude, on the south coast) of historical range limits and extent of recent observations. Data dictionary: - #: Corresponds to alphabetical ordered species, and the numbers on the preview map. - Species name: Species scientific name. - State: state(s) along which potential range extension occurred (to distinguish disparate extensions of the same species, e.g. on both east and west coasts). - Confidence in range extension: qualitative estimate that out-of-range observations represent an ongoing range extension produced by the assessment. - Historical distribution limit: latitude (or longitude on the south coast) of the species’ poleward known distributional limit as of 2012. - New extent: latitude (or longitude on the south coast) of new poleward-most extent provided by citizen science observations of the species from 2013-2022. - Distance (km): latitudinal (or longitudinal, insofar as inferred to be occurring along the south coast) distance between historical distribution limit and new extent, in kilometres. - Notes: “adults” indicates range extensions of adult life stages only (i.e., into areas where juveniles were previously known to occur). eAtlas Processing: The original data were provided as a csv file with a png map and preview image (jpg). No modifications to the underlying data were performed and the data package are provided as submitted. Location of the data: This dataset is filed in the eAtlas enduring data repository at: data\\custodian\2021-2022-NESP-MaC-1\1.30_Climate-driven-species-redistributionMaintenance and Update Frequency: asNeeded&rft.creator=Wolfe, Barrett &rft.creator=Pecl, Gretta &rft.creator=Kjeldsen, Shannon &rft.creator=Strugnell, Jan &rft.creator=Watson, Sue-Ann &rft.date=2022&rft.coverage=144.4959579883258,-37.95732020910742 146.1168902327929,-38.649107939999986 147.59563950799355,-37.71026424675038 149.64313497965185,-37.55261590331804 150.12657483120364,-35.658031507540905 151.37782333671845,-33.00487548889871 152.6575072905353,-31.828615549210333 153.48218970498064,-28.560333086812285 152.93351918001605,-27.399916417710962 152.86308194390415,-25.42383188079124 151.767839540057,-24.472444779101664 150.6987710148878,-23.46910052825467 150.53798765116974,-22.757446370945544 149.90490246077175,-22.66474806145669 149.41856249203042,-22.049737929922088 149.36549205408008,-21.605529570902533 149.1096863943088,-21.129087567895994 148.59807650596701,-20.717586918626594 148.45596256858312,-20.211637915321177 147.64591298237494,-19.94468424629501 147.41853096880087,-19.570190835379265 146.82165300426885,-19.369209958571034 146.19635139353966,-18.926181006854534 147.37589693070575,-18.88584667988492 151.95196514198645,-21.81678207189188 153.62689800530674,-24.481590672089027 153.61684974083252,-26.125861111500896 154.11870652024683,-29.171700636105093 153.22434823730558,-32.1192643968799 150.98983511348396,-35.395421718401934 150.22219544109174,-37.74268156650668 148.06206416533706,-38.44727690073627 148.9431700046368,-39.94503261597518 148.843690105348,-42.823196027148754 148.04784804863627,-43.85674211862952 146.78303443527997,-44.25505423597989 145.04924497167696,-43.5588255690737 143.90159515891153,-41.76156468689596 143.1164942782955,-39.178117200443594 139.93315181306153,-38.04548367356491 138.92413813467363,-36.060884839698694 136.7497978982218,-36.47337812857097 131.36879782416668,-32.828849254953234 125.30245336379981,-33.32052052620178 123.93579224216687,-34.18941779160869 120.63973075591707,-34.53781175093535 117.88631198370263,-35.52520342169035 115.17309031743231,-34.95067416286521 114.42946612172304,-34.33890684391192 114.77113342615473,-32.42591137353566 114.38714736491029,-31.3949422329595 114.04760575939407,-29.96783534835516 112.96231628327656,-28.88253634779708 112.96231830730005,-27.340356711211207 112.3593799343485,-25.45020133817532 112.96231628327654,-22.401120983942576 114.56574001740208,-20.71773858515833 116.68413352010032,-20.950186053893404 115.0063246512726,-21.98229715735191 113.57289473733302,-24.237534518144443 114.37722737204719,-25.85878516893709 113.85441156449656,-26.81389004803699 114.35711946119287,-27.832167372241045 115.09164245169188,-29.108384468494975 115.37601411798153,-30.783867135700497 116.0585135631604,-32.118092816767444 115.77413903299241,-33.5753725426643 115.09164245169188,-33.859217749439836 115.63195033596922,-34.30671550412265 117.8216345046507,-34.845248786112926 119.75537959146612,-33.859217749439836 123.28162147444668,-33.71741244867688 124.73193243746701,-32.62247653335247 126.21067884878927,-32.04580882076896 129.8547157717993,-31.316693522265986 129.85074983715785,-31.313372052003757 129.86528126475673,-31.31457953091126 129.87131610963215,-31.313372052003757 129.87361722465133,-31.315272201722742 133.7092890149063,-31.63399469140215 135.58446418415426,-34.330624690899576 137.8014413211026,-32.444078006409605 138.46937840112767,-34.14264306746092 139.22330463307824,-35.00566877938618 140.5300269151921,-37.61896355683903 143.55752232515925,-38.62689570809128 144.4959579883258,-37.95732020910742&rft_rights=Creative Commons Attribution 4.0 International License http://creativecommons.org/licenses/by/4.0/&rft_rights=Please cite as: Wolfe, B. W., Pecl, G., Kjeldsen, S., Strugnell, J., & Watson, S.-A. (2022). Extralimital citizen science observations of marine species relative to historical poleward range limits, 2013–2022 (NESP MaC Project 1.30; IMAS, JCU and DPIRD) [Data set]. eAtlas. https://doi.org/10.26274/J7SR-RP22&rft_subject=environment&rft_subject=National Environmental Science Program (NESP) Marine and Coastal Hub&rft_subject=marine&rft_subject=MARINE&rft_subject=Coastal Waters (Australia)&rft.type=dataset&rft.language=English Access the data

Licence & Rights:

Open Licence view details
CC-BY

Creative Commons Attribution 4.0 International License
http://creativecommons.org/licenses/by/4.0/

Please cite as: Wolfe, B. W., Pecl, G., Kjeldsen, S., Strugnell, J., & Watson, S.-A. (2022). Extralimital citizen science observations of marine species relative to historical poleward range limits, 2013–2022 (NESP MaC Project 1.30; IMAS, JCU and DPIRD) [Data set]. eAtlas. https://doi.org/10.26274/J7SR-RP22

Access:

Other

Contact Information


Full description

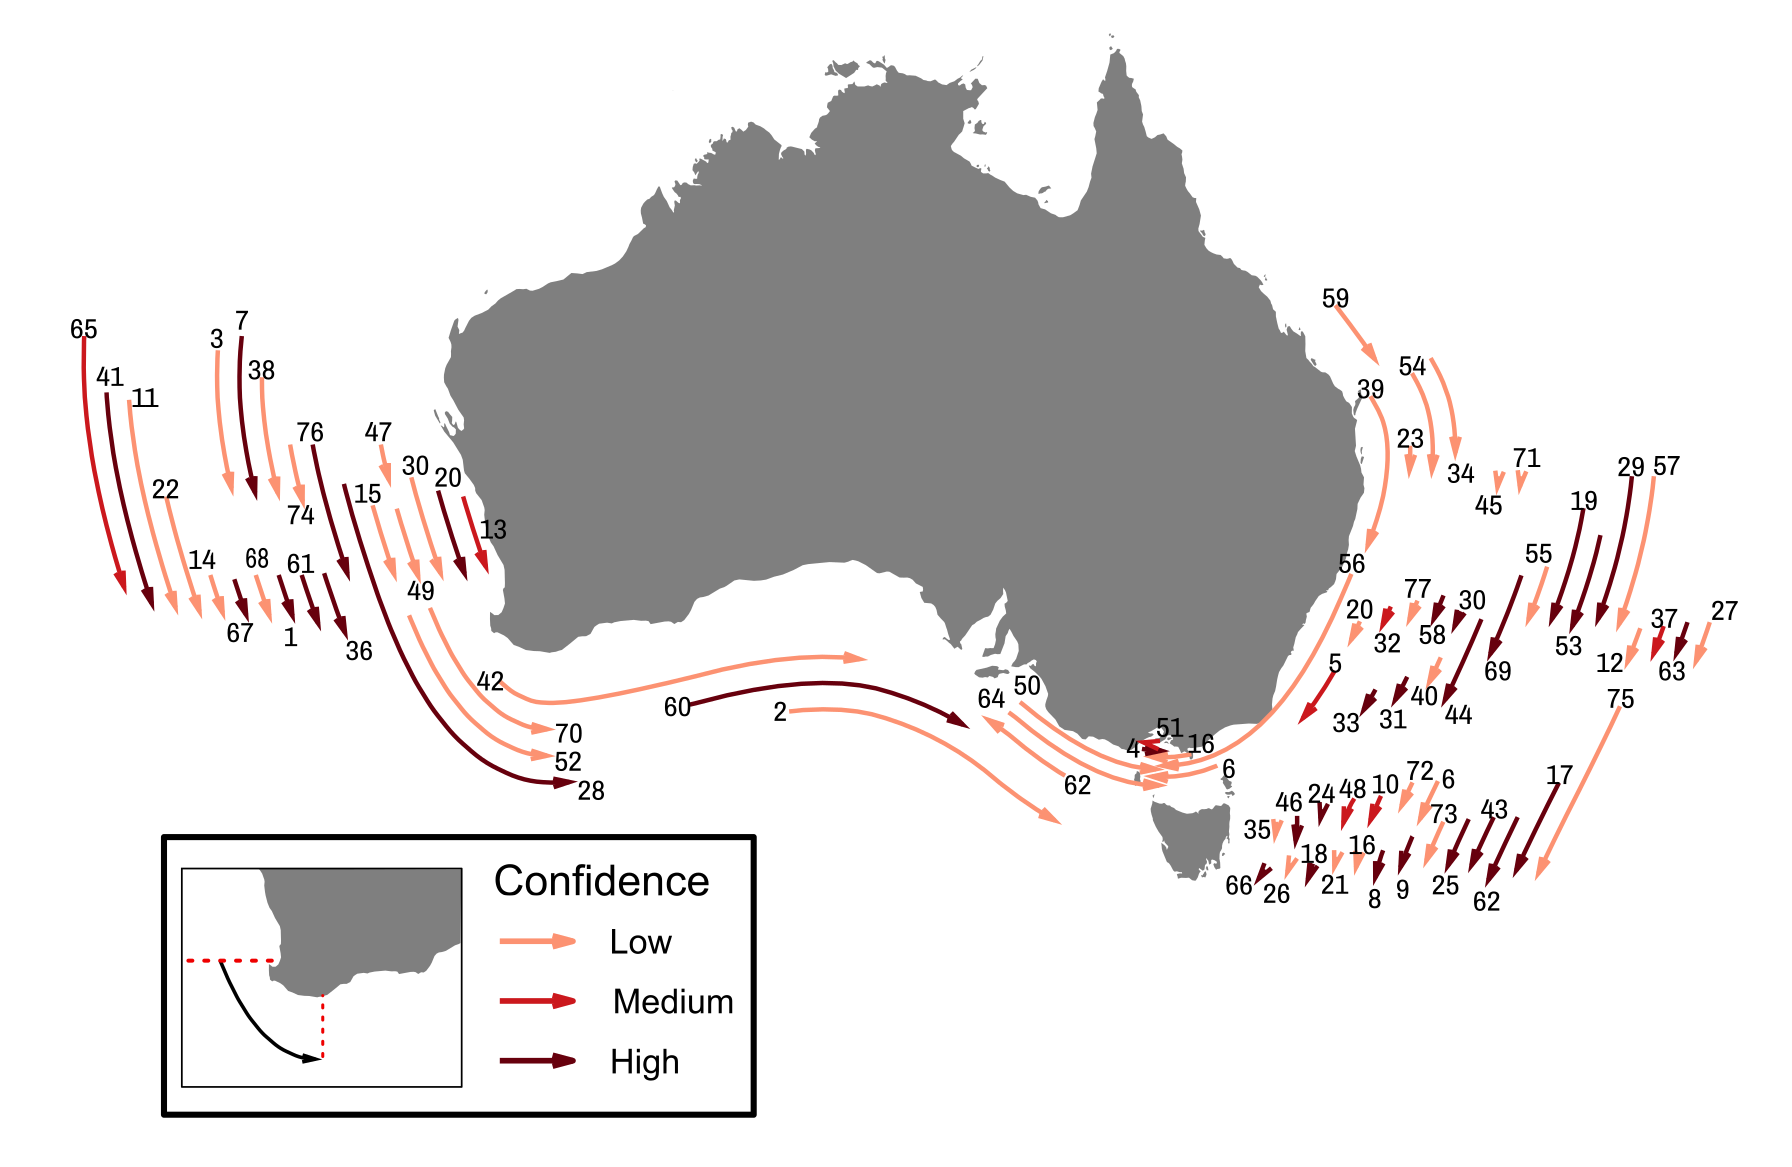
This dataset consists of the historical range limits and poleward-most extent of recent extralimital occurrence of 82 potential marine species’ range extensions around Australia (NSW, QLD, SA, TAS, VIC and WA) revealed by an assessment of citizen scientists observations from Redmap, Reef Life Survey, and iNaturalist from 2013–2022. The purpose of this project was to assess evidence for climate-driven marine species range extensions with data provided by Australian citizen scientists. While there are at least 198 documented range shifts of marine species in the scientific literature, there are large gaps in our ability to formally monitor changes in species distributions both geographically and across taxonomic groups that citizen scientists (beachcombers, divers, fishers, snorkelers, etc.) can help resolve. This assessment had two main components: Establish historical poleward range limits for each of 200 target species tracked by Redmap (up to the year 2012); and assess the evidence for extralimital occurrence of each species in the subsequent decade across three citizen science databases (Redmap, Reef Life Survey, iNaturalist). Confidence of species range extension occurring was qualitatively estimated (high, medium, or low) based on species traits (e.g., mobility, detectability) and strength of evidence provided by citizen science data (e.g., evidence of overwintering, multi-year detections). These results provide an early indication of species and regions where more focused monitoring or research effort may be warranted. These findings were developed into report cards for dissemination to both demonstrate the value of citizen science and engage with the public on climate change and marine biodiversity, using their own information. Methods: This assessment had two main components: 1) Establish historical poleward range limits up to the year 2012 for each of 200 target species; and 2) assess the evidence for extralimital occurrence of each species in the subsequent decade across three citizen science databases (Redmap, Reef Life Survey, iNaturalist). Confidence of species range extension occurring was qualitatively estimated (high, medium, or low) based on species traits (e.g., mobility, detectability) and strength of evidence provided by citizen science data (e.g., evidence of overwintering, multi-year detections). These methods were a modified version of the Robinson et al. (2015) framework developed through a workshop process in November 2021. The assessment target species list consisted mainly of species on the Redmap (Range Extension Database and Mapping project) target list and a select opportunistic additions, totalling 200 species. Species historical poleward range limits were established up to the year 2012 from both distributional references such as Australian Faunal Directory (AFD, ABRS 2009) and Australian National Expert Fish Distributions (https://researchdata.edu.au/australian-national-fish-expert-distributions/671428) and a review of available raw occurrence data (Atlas of Living Australia, pre-2013 citizen science observations of target species, etc.) to document the poleward-most known occurrences of each target species. Species for which there was uncertainty regarding taxonomy or historical distribution limits that would have a bearing on assessment results were excluded from the assessment. A 20 km buffer was added on to range limits to reduce artifact from range limits established to low precision. Citizen science observations of target species up to February 2022 were accessed from iNaturalist Australasian Fishes project, Redmap, and Reef Life Survey (via the Australian Ocean Data Network). iNaturalist records underwent additional verification by species experts, and as Reef Life Survey data does not formally have photographic evidence associated with it, these data were only used in a corroboratory role for species for which extralimital observations from the other citizen science databases were available. Confidence of potential range extensions evidence by extralimital observations was estimated qualitatively based on detections across multiple years and for non-highly-mobile species, evidence of overwintering (during the coldest months of the year on either coast). Detectability, due to rarity, small size and/or cryptic colouration/behaviour was also taken into consideration. To summarise the extent of each assessed range extension, the assessed historical range limit and the most out-of-range observation were identified for each species and collated in this data set. Locations represent latitudes, or on the south coast, longitudes. Limitations of the data: These data only represent the latitudes (or longitudes on the south coast) of species range limits (as of 2012) and recent extralimital observations rather than precise coordinates. These results only reflect the assessment of 200 target species and not an exhaustive list of marine species range extensions to the present or those reflected in the citizen science databases. Not all assessed extralimital observations indicate a species is undergoing a geographical range extension (see confidence estimates) Format of the data: The dataset consists of a table with 82 instances of potential marine species range extensions noted by the latitude (or longitude, on the south coast) of historical range limits and extent of recent observations. Data dictionary: - #: Corresponds to alphabetical ordered species, and the numbers on the preview map. - Species name: Species scientific name. - State: state(s) along which potential range extension occurred (to distinguish disparate extensions of the same species, e.g. on both east and west coasts). - Confidence in range extension: qualitative estimate that out-of-range observations represent an ongoing range extension produced by the assessment. - Historical distribution limit: latitude (or longitude on the south coast) of the species’ poleward known distributional limit as of 2012. - New extent: latitude (or longitude on the south coast) of new poleward-most extent provided by citizen science observations of the species from 2013-2022. - Distance (km): latitudinal (or longitudinal, insofar as inferred to be occurring along the south coast) distance between historical distribution limit and new extent, in kilometres. - Notes: “adults” indicates range extensions of adult life stages only (i.e., into areas where juveniles were previously known to occur). eAtlas Processing: The original data were provided as a csv file with a png map and preview image (jpg). No modifications to the underlying data were performed and the data package are provided as submitted. Location of the data: This dataset is filed in the eAtlas enduring data repository at: data\\custodian\2021-2022-NESP-MaC-1\1.30_Climate-driven-species-redistribution

Lineage

Maintenance and Update Frequency: asNeeded

Notes

Credit
The data collections described in this record are funded by the Australian Government Department of Agriculture, Water and the Environment (DAWE) through the NESP Marine and Coastal Hub. In addition to NESP (DAWE) funding, this project is matched by an equivalent amount of in-kind support and co-investment from project partners and collaborators.

Data time period: 2012-12-31 to 2022-02-15

This dataset is part of a larger collection

Click to explore relationships graph

144.49596,-37.95732 146.11689,-38.64911 147.59564,-37.71026 149.64313,-37.55262 150.12657,-35.65803 151.37782,-33.00488 152.65751,-31.82862 153.48219,-28.56033 152.93352,-27.39992 152.86308,-25.42383 151.76784,-24.47244 150.69877,-23.4691 150.53799,-22.75745 149.9049,-22.66475 149.41856,-22.04974 149.36549,-21.60553 149.10969,-21.12909 148.59808,-20.71759 148.45596,-20.21164 147.64591,-19.94468 147.41853,-19.57019 146.82165,-19.36921 146.19635,-18.92618 147.3759,-18.88585 151.95197,-21.81678 153.6269,-24.48159 153.61685,-26.12586 154.11871,-29.1717 153.22435,-32.11926 150.98984,-35.39542 150.2222,-37.74268 148.06206,-38.44728 148.94317,-39.94503 148.84369,-42.8232 148.04785,-43.85674 146.78303,-44.25505 145.04924,-43.55883 143.9016,-41.76156 143.11649,-39.17812 139.93315,-38.04548 138.92414,-36.06088 136.7498,-36.47338 131.3688,-32.82885 125.30245,-33.32052 123.93579,-34.18942 120.63973,-34.53781 117.88631,-35.5252 115.17309,-34.95067 114.42947,-34.33891 114.77113,-32.42591 114.38715,-31.39494 114.04761,-29.96784 112.96232,-28.88254 112.96232,-27.34036 112.35938,-25.4502 112.96232,-22.40112 114.56574,-20.71774 116.68413,-20.95019 115.00632,-21.9823 113.57289,-24.23753 114.37723,-25.85879 113.85441,-26.81389 114.35712,-27.83217 115.09164,-29.10838 115.37601,-30.78387 116.05851,-32.11809 115.77414,-33.57537 115.09164,-33.85922 115.63195,-34.30672 117.82163,-34.84525 119.75538,-33.85922 123.28162,-33.71741 124.73193,-32.62248 126.21068,-32.04581 129.85472,-31.31669 129.85075,-31.31337 129.86528,-31.31458 129.87132,-31.31337 129.87362,-31.31527 133.70929,-31.63399 135.58446,-34.33062 137.80144,-32.44408 138.46938,-34.14264 139.2233,-35.00567 140.53003,-37.61896 143.55752,-38.6269 144.49596,-37.95732

133.2390432273,-31.570450457932

Subjects

User Contributed Tags    

Login to tag this record with meaningful keywords to make it easier to discover

Other Information
Link to dataset [csv file + Preview map of this dataset and preview image] (Download a copy)

url : https://nextcloud.eatlas.org.au/apps/sharealias/a/AU_NESP-MaC-1.30-Climate-driven-species-redistribution-data

Map of species distribution movements and confidence in range extension. Numbers for species ID are represented in the CSV datafile (NESP_MaC_1.30_overview.png)

url : https://catalogue.eatlas.org.au/geonetwork/srv/api/records/c9cb841d-c84d-40d3-9c17-42ae3f5dcde7/attachments/NESP_MaC_1.30_overview.png

global : f1ad3f5c-cfa3-488d-ad65-be19afaf0adb

ror : 01nfmeh72

ror : 01nfmeh72

ror : 04gsp2c11

ror : 04gsp2c11

ror : 04gsp2c11

ror : 01nfmeh72

NESP MaC Project 1.30 - National Assessment of Climate-Driven Species Redistribution using Citizen Science Data, 2021-2022 (UTAS)

raid : 10.82210/392e14e7

Identifiers
  • global : c9cb841d-c84d-40d3-9c17-42ae3f5dcde7

ACN 633 798 857