
Brief description
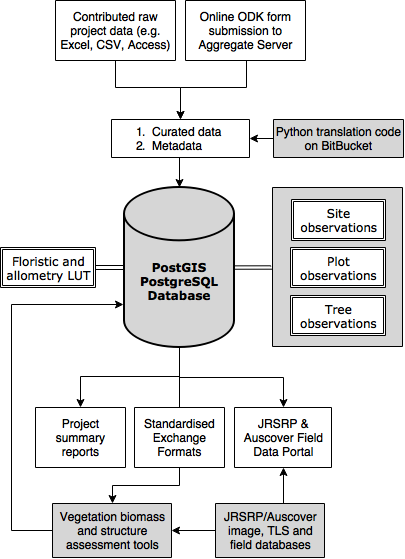
The Biomass Plot Library is a collation of stem inventory data across federal, state and local government departments, universities, private companies and other agencies. It was motivated by the need for calibration/validation data to underpin national mapping of above-ground biomass from integration of Landsat time-series, ICESat/GLAS lidar, and ALOS PALSAR bacscatter data under the auspices of the JAXA Kyoto & Carbon (K&C) Initiative (Armston et al., 2016). At the time of Version 1.0 publication 1,073,837 hugs of 839,866 trees across 1,467 species had been collated. This has resulted from 16,391 visits to 12,663 sites across most of Australia's bioregions. Data provided for each project by the various source organisation were imported to a PostGIS database in their native form and then translated to a common set of tree, plot and site level observations with explicit plot footprints where available.
Data can be downloaded from https://field.jrsrp.com/ by selecting the combinations Tree biomass and Site Level, Tree Biomass and Tree Level.
Lineage
Data Creation
Estimations:
The above-ground, below-ground and total biomass (live+dead) estimation was implemented using the generic allometric models for Australian plant functional types developed by Paul et al. (2016) and decay correction factors implemented by Lucas et al. (2010). Site level estimates of biomass error were derived through comprehensive analysis of measurement and allometric model prediction errors (Paul et al., 2016), propagating the random error (precision) associated with the development of the allometric models, all the way through to the prediction of total site biomass.
Field Overview:
Field Data Overview
Notes
CreditWe at TERN acknowledge the Traditional Owners and Custodians throughout Australia, New Zealand and all nations. We honour their profound connections to land, water, biodiversity and culture and pay our respects to their Elders past, present and emerging.
The following organisations contributed to the Biomass Plot Library: Commonwealth Scientific and Industrial Research Organisation (CSIRO); Flinders University, South Australia; Victorian Department of Environment, Land, Water and Planning (DELWP); Queensland Herbarium, Department of Environment and Science (DES); Western Regeneration Pty. Ltd.; Department of the Environment, Australia; Charles Darwin University, Northern Territory; Darwin Centre for Bushfire Research; NSW Office of Environment and Heritage (OEH); TERN Ausplots; TERN Supersite Network; University of New South Wales; University of Queensland; Queensland Department of Agriculture and Fisheries (DAF); Forestry Tasmania; Queensland Remote Sensing Centre, DES; Department of Parks and Wildlife, Western Australia; New South Wales Forestry Corporation; Joint Remote Sensing Research Program.
This is a national collation of tree and shrub inventory data, allometric model predictions of above and below-ground biomass for Australia, for the purpose of calibrating and validating satellite-derived products.
Data Quality Assessment Scope
local :
dataset
<p>Site level Spatial domain - preliminary analysis indicates a relative paucity of observations in the Great Western Woodlands and Kimberley regions in Western Australia, and the savanna woodlands of Cape York in Queensland. An assessment will be presented in a forthcoming publication. Temporal domain - the majority of sites were surveyed between 1995 and 2015, which is coincident with most satellite sensor data used to support regional to global above-ground biomass mapping. Many plots are very small in size (<0.1 ha) and should be considered in methods used to link these field data with remote sensing data.</p>
Data Quality Assessment Result
local :
Quality Result
<p>The relative tree level error contributions summarised over the whole dataset are as follows: 1) Allometric model development – moisture content determination for converting fresh mass into dry mass = 5.3%. 2) Allometric model development – fresh mass weighing errors = 0.2%. 3) Allometric model development – Diameter measurement of individual trees = 0.1%. 4) Allometric model development – Allometric model fit errors = 5.1%. 5) Inventory - individual diameter measurement errors = 1.1%. 6) Allometric model prediction errors = 88.2%.</p> <p>A number of site observation locations were not measured using GPS units that could achieve positional accuracy <10 m. This is generally only the case for sites last surveyed prior to 2000 and is continuously improving as sites are revisited.</p>
Created: 2016-04-14
Issued: 2021-12-03
Modified: 2026-07-07
Data time period: 1936-11-26 to 2015-10-20
text: Australia
User Contributed Tags
Login to tag this record with meaningful keywords to make it easier to discover
- URI : geonetwork.tern.org.au/geonetwork/srv/eng/catalog.search#/metadata/fc4a7249-ebb2-4ada-8e06-b552bfb297a3

- global : fc4a7249-ebb2-4ada-8e06-b552bfb297a3
