
Brief description
Public Transport Accessibility Level (PTAL) is a measure of connectivity by public transport and is used for various planning processes. PTAL suggests how well a place is connected to public transport services. It does not cover trips by car.The TfNSW PTAL model calculates public transport accessibility for every Australian Bureau of Statistics Mesh Block in New South Wales (NSW). The TfNSW PTAL model is based on the Transport for London (TfL) and was adapted for TfNSW in collaboration with the Spatial Information Science team at the Department of Earth and Environmental Sciences, Macquarie University. The full details of the TfL PTAL model can be found [here](http://content.tfl.gov.uk/connectivity-assessment-guide.pdf).
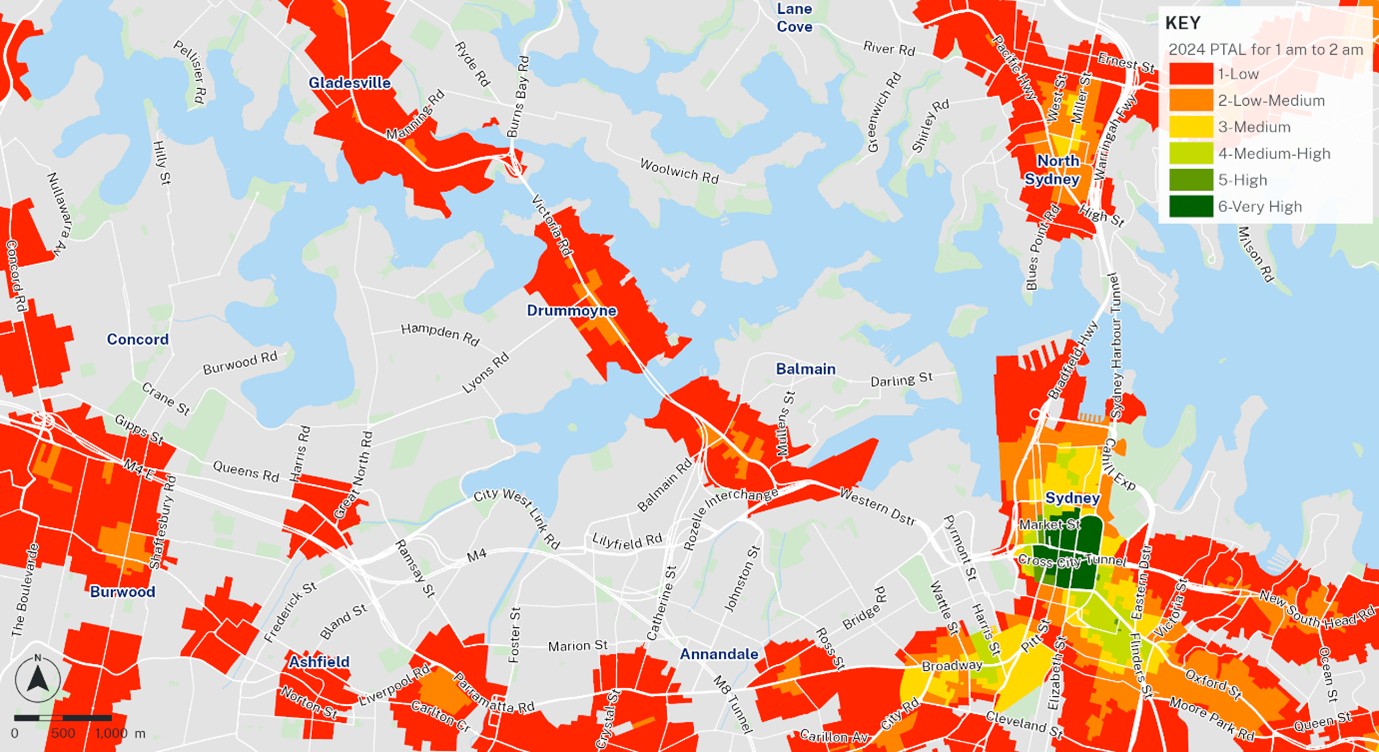
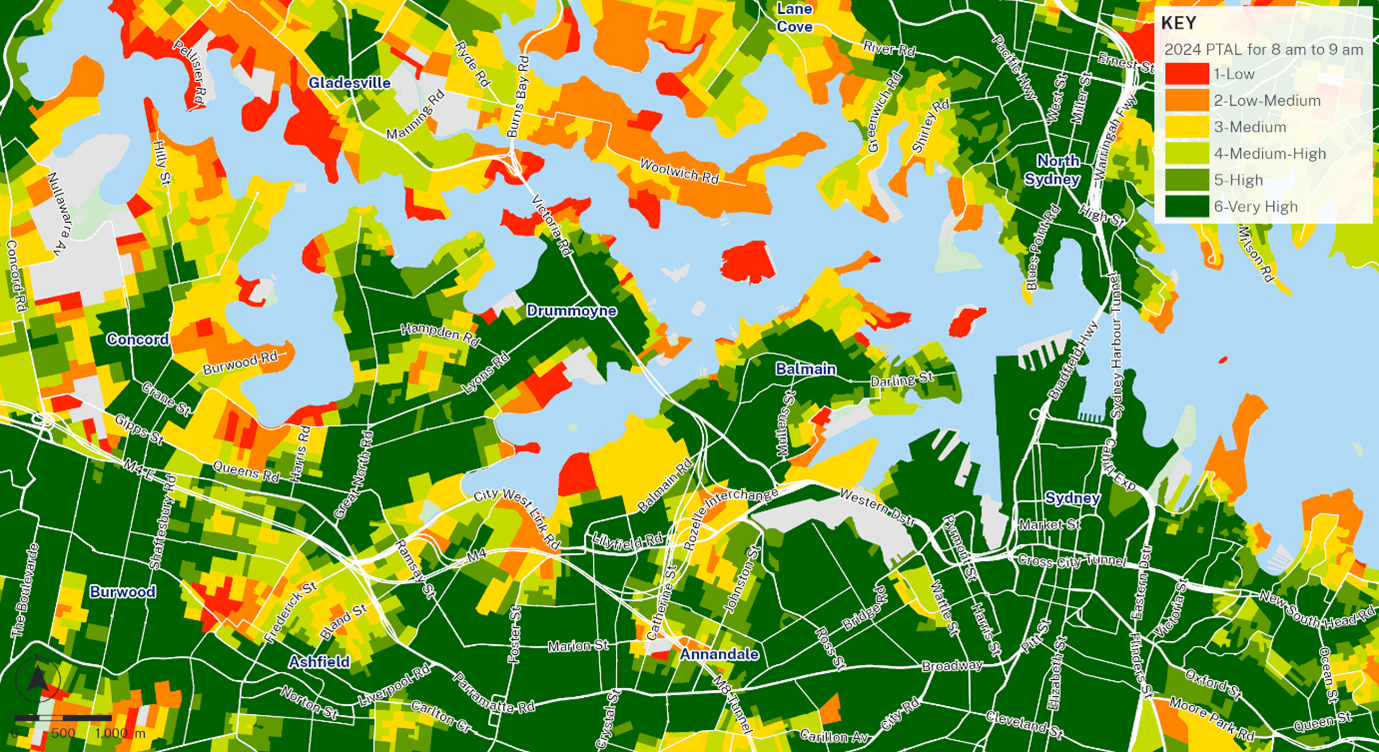
PTAL values range from zero to six, where the highest value represents the best connectivity. PTAL is available for each hour of the day.
A location will have a higher PTAL if:
\\-\tIt is a short walking distance to the nearest stations or stops
\\- \tWaiting times at the nearest stations or stops are short
\\-\tMore services pass at the nearest stations or stops
\\-\tThere are major rail stations nearby
\\-\tAny combination of all the above.
Please read the PTAL Fact sheet for more information. The format of the data is ArcGIS geodatabase.
**The images below are examples of PTAL data in 2024.**
Other Information
Transport for NSW
url :
http://data.nsw.gov.au/data/organization/transport-for-nsw![]()
Identifiers
- URI : data.nsw.gov.au/data/dataset/2-ptal-public-transport-accessibility-level

- Local : dd3a4b91-9fae-4424-b823-e888a0524ec1
